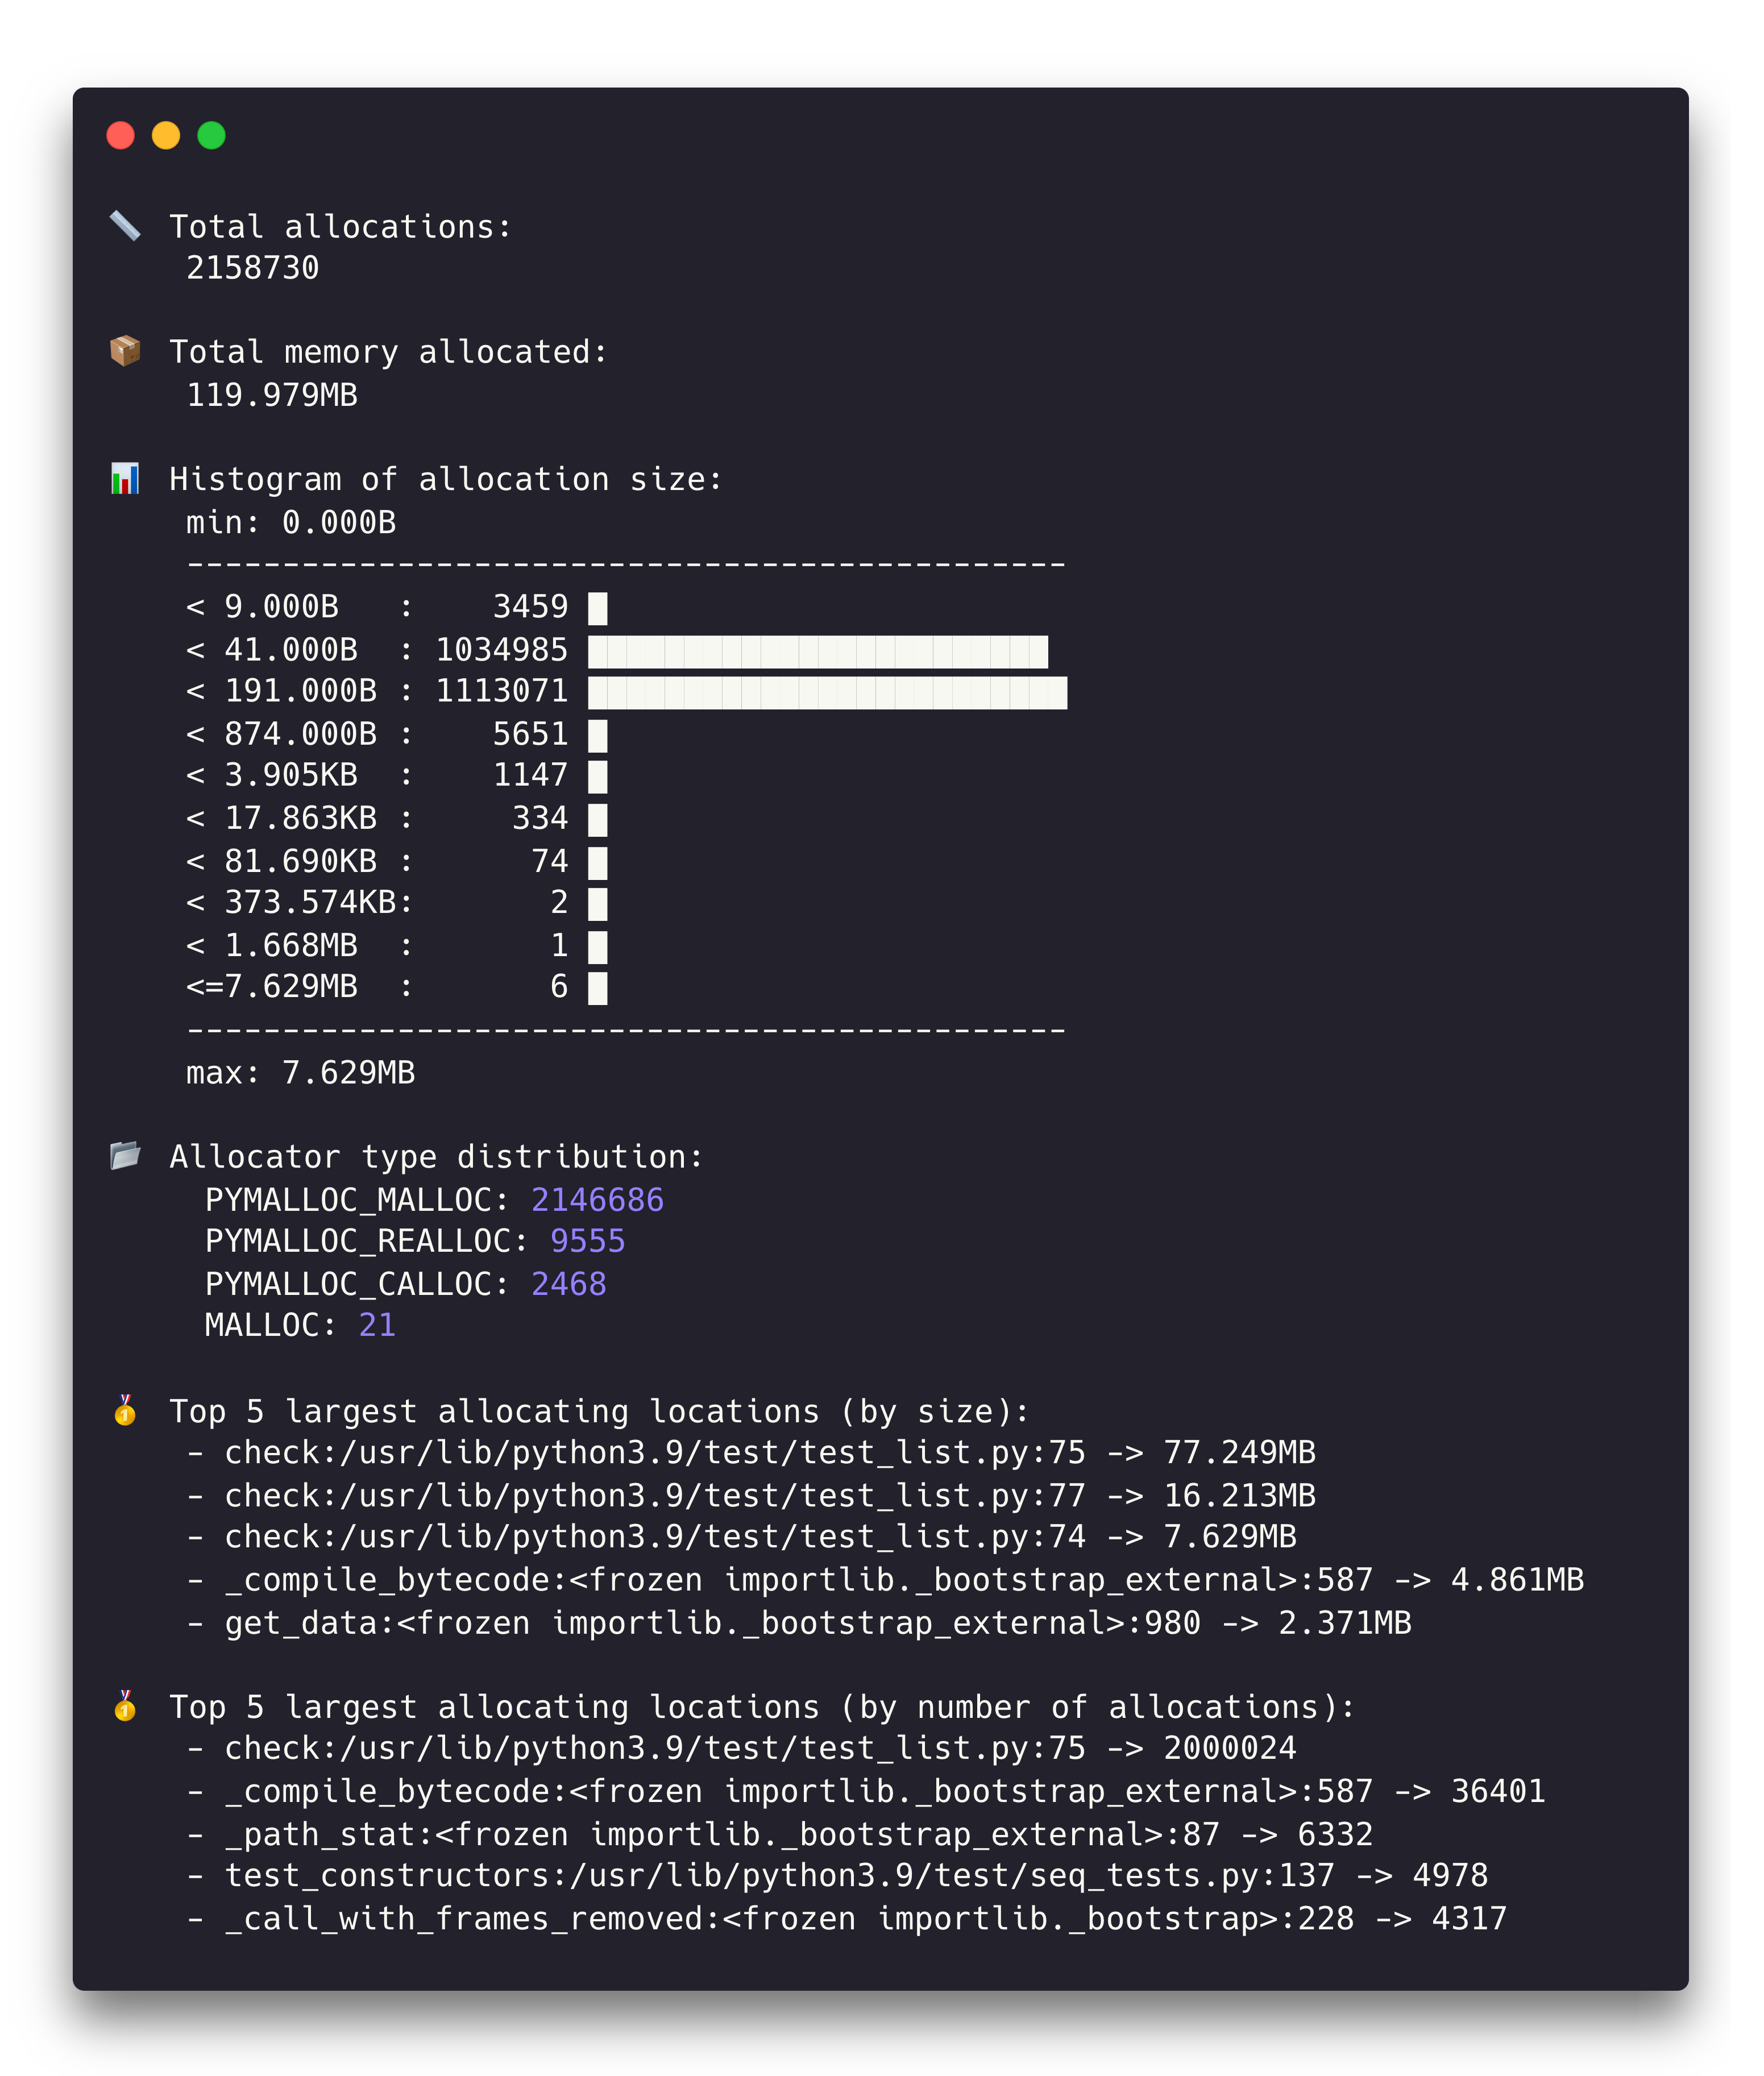
The endgame Python memory profiler
Memray tracks and reports memory allocations, both in Python code and in compiled extension modules.
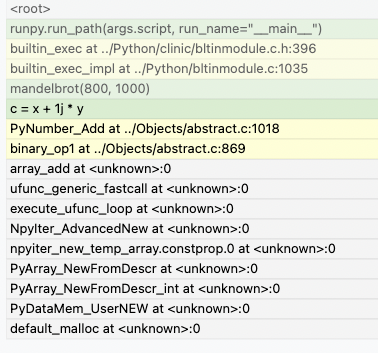
See where it happens
Memray knows the stack trace of every single allocation that happens in your code, no matter how small it is. This lets you see exactly where your memory is being allocated and gives you insights on how to optimize your code.
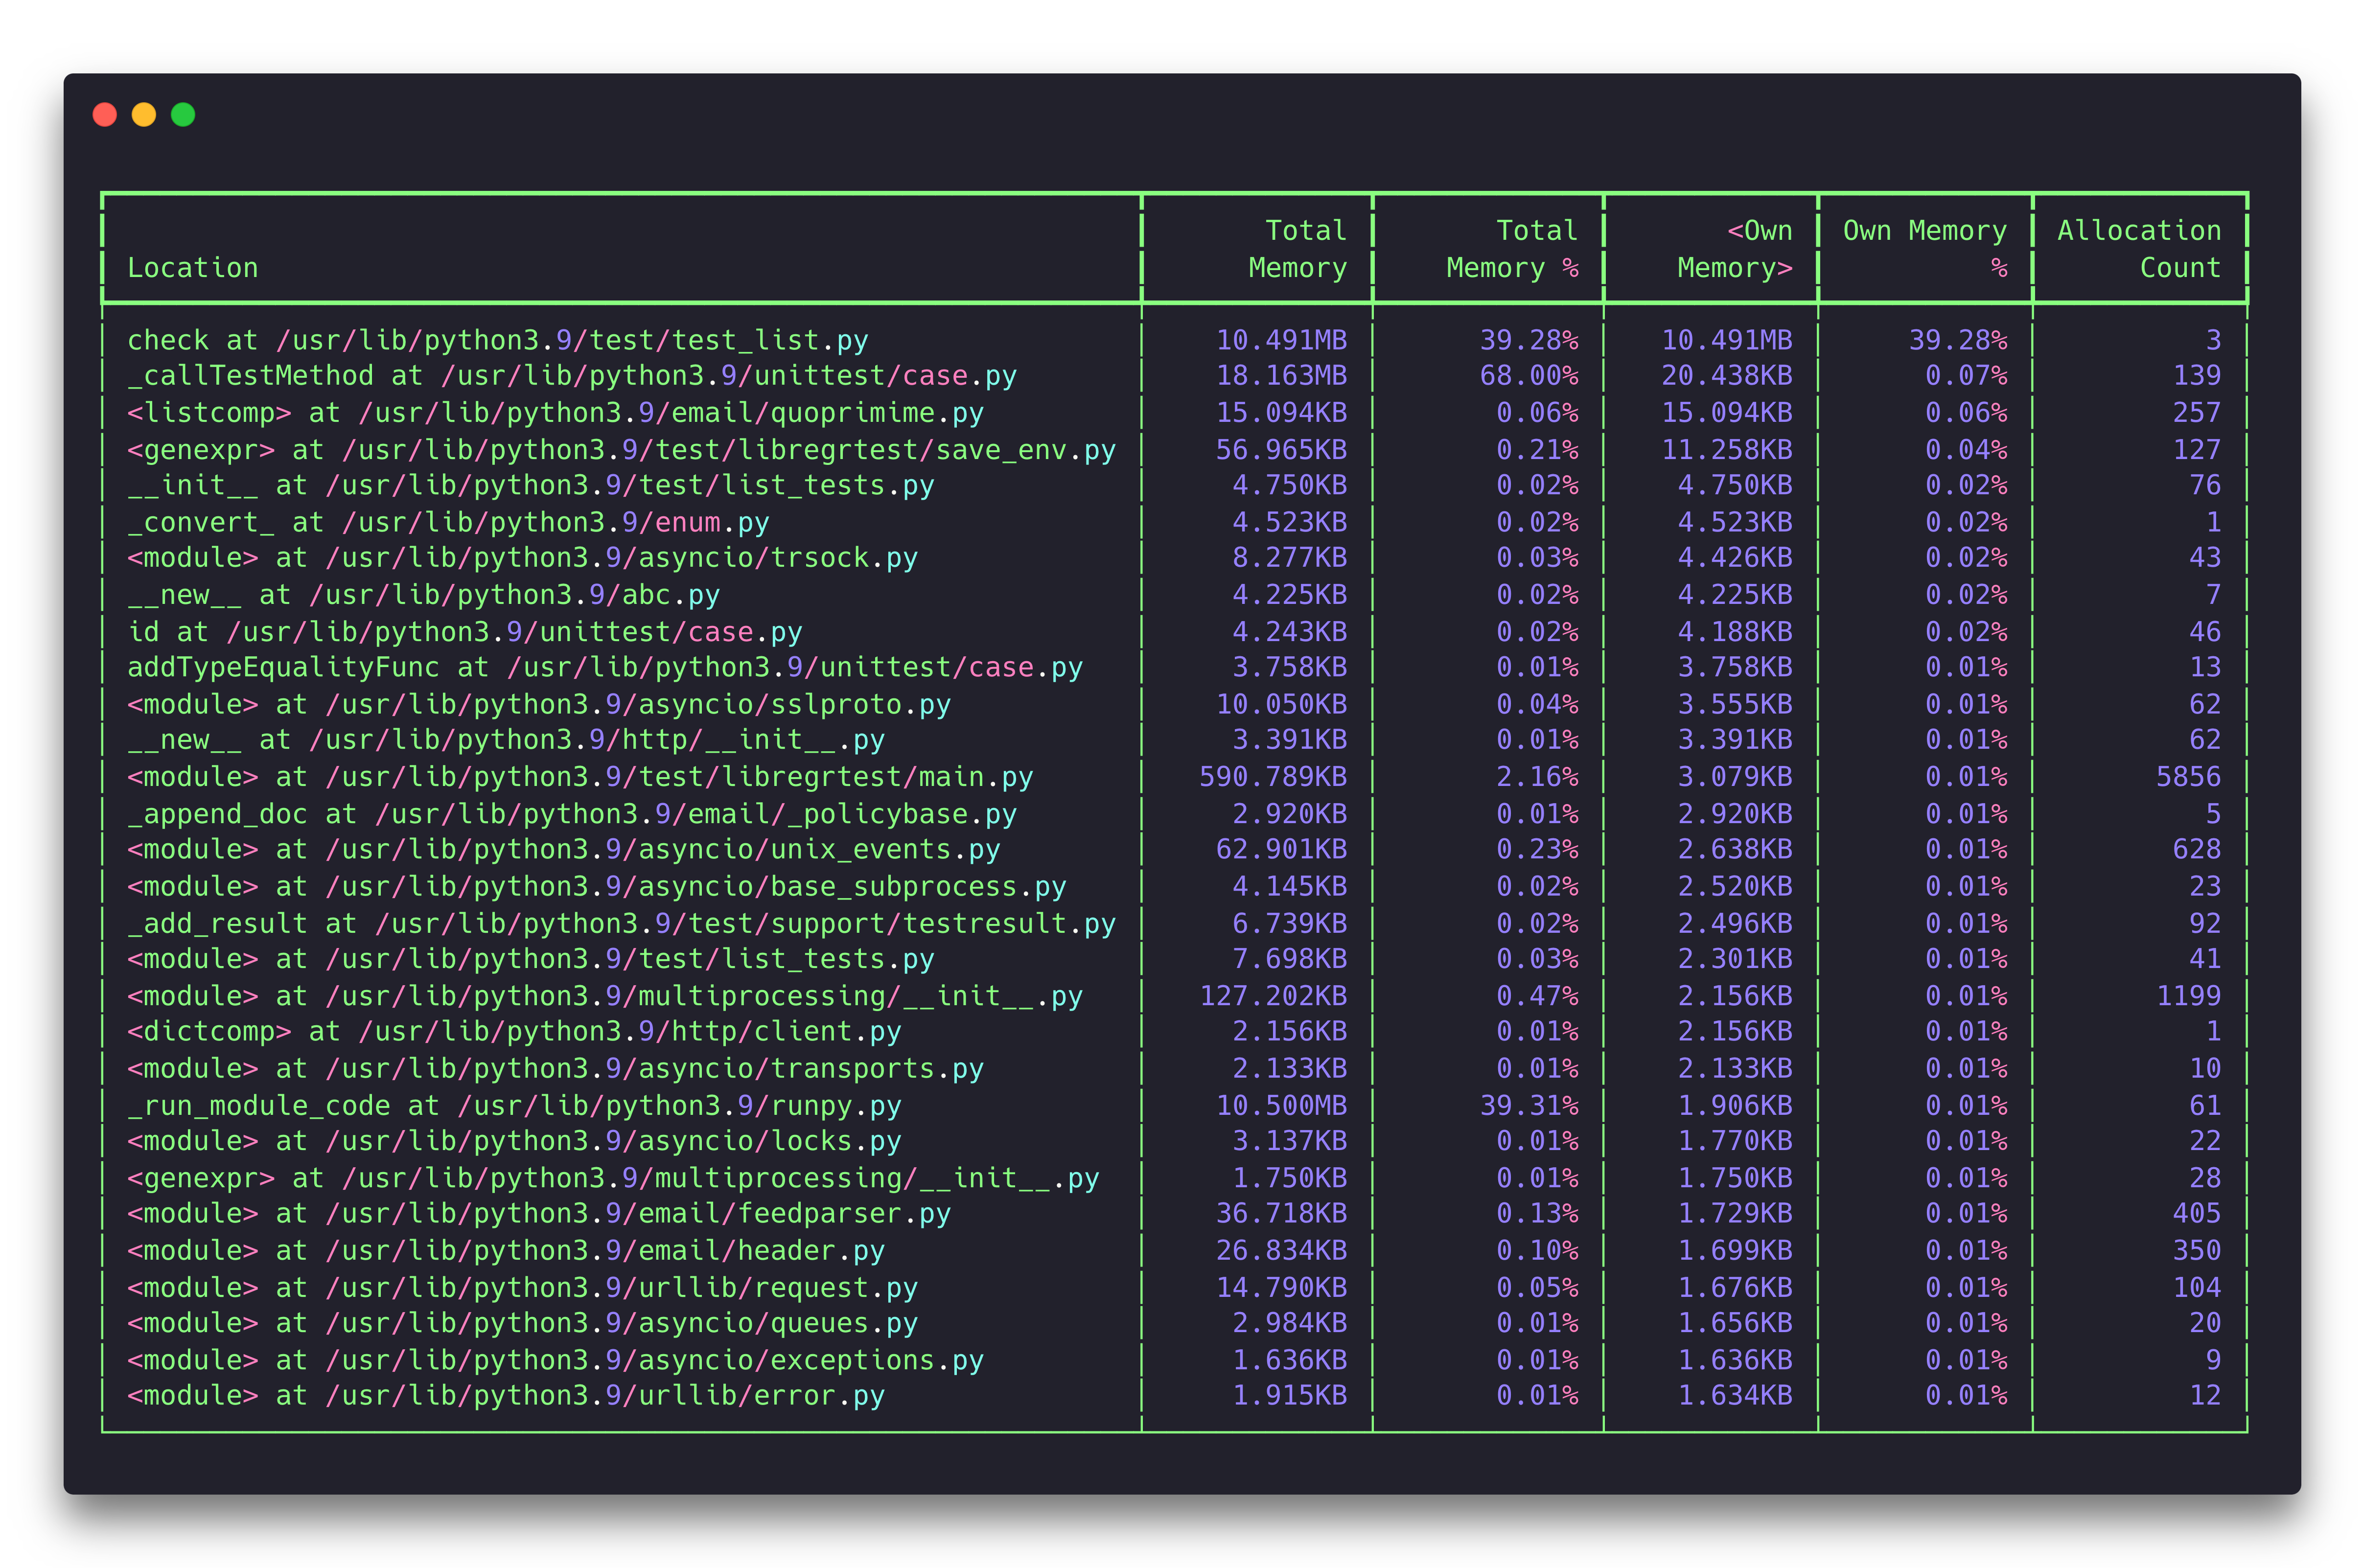
More than just a profiler
Memray does much more than just telling you where your application is spending memory and which memory is being leaked. For instance, it can help you find wasteful temporary allocations that you can avoid to speed up your program.
Prevent regressions
You can easily integrate Memray into your pytest test suite. Learn where each test is spending its memory with per-test allocation summaries with useful statistics, or set limits on how much memory each test is allowed to use to prevent memory regressions!
Native allocation tracking. No more leaks in C extensions.
Memray sees allocations made by C/C++/Rust libraries. This means that when you use Memray to profile your Python code, you'll be able to see the entire call stack, including any calls to C/C++/Rust functions. This can be incredibly useful for tracking down memory issues, as it allows you to see exactly where and how memory is being allocated. Whether you're working on a complex project with many layers of code, or simply trying to optimize your Python scripts for better performance, Memray is an invaluable tool that can help you understand and improve your code's memory usage.
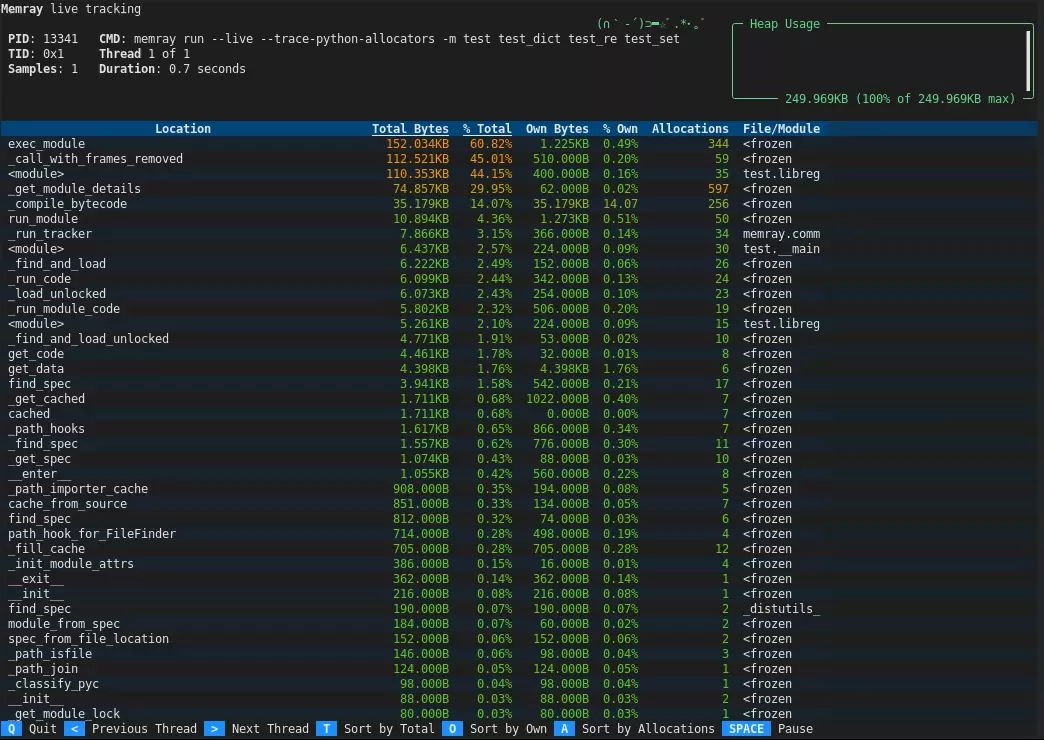
Catch it as it happens! Live memory profiling.
One of the standout features of Memray is its ability to provide a live, real-time view of memory allocation. With the live mode, you can see exactly how memory is being used as your Python code is executing. This can be particularly useful for debugging and optimizing your code, as you can see in real-time how different parts of your code are impacting memory usage.
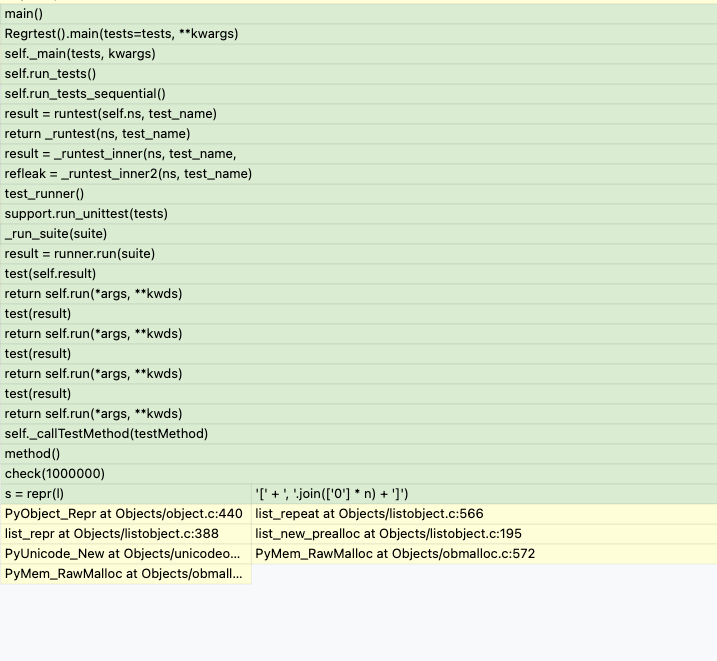
One log, many analyses. There's a reporter for everyone!
One of the great things about Memray is its flexibility and customizability. After running a memory profiling session, you can use a wide range of reporters to view the data in different ways. For example, you can use the flamegraph reporter to see a visual representation of the call stack and how memory is being used at each level. Or, you can use the statistical reporter to see summary statistics and trends in your memory usage. And these are just a few of the many reporters available in Memray - there are many more to choose from, allowing you to view your data in the way that makes the most sense for your specific needs.
